Context
Climate change has broad impacts and will continue to influence our lives for decades to come. Properly accounting for climate change is imperative as it enables the development of proactive strategies that minimize the adverse impacts of climate variability.
Scientifically sound climate data is crucial for effective climate adaptation efforts. Detailed climate data informs infrastructure design, ensuring that critical systems are resilient to extreme weather events and long term changes in climate patterns. For agriculture, this information guides the selection of crops and farming practices suited to evolving conditions, helping to secure food supplies.
Without reliable and comprehensive climate data, efforts to combat climate change are significantly hampered, increasing the risk of severe ecological and societal consequences.

Solution
Finding reliable climate data, at sufficient spatial resolution and tailored to your needs, can be challenging.
VITO's climate modelling team is capable of providing and tailoring climate datasets to your needs. We generate custom climate date at high resolutions for any region in the world up to 2100 and we translate raw climate data into ready-to-use information.
We are active worldwide and act as data-provider for Copernicus and the World Bank.
Whether you are active in agriculture, biodiversity or urban environments, we empower you against climate change impacts and facilitate data-driven decision-making, planning and adaptation strategies.
About the data
A wealth of climate data can be generated:
- We are able to combine urban growth models (www.geodynamix.eu) with various climate change scenarios, resulting in hourly urban climate data at 100m resolution, up to 2100;
- We can translate the raw model output into quantification of e.g. number and duration of heat wave days, cooling degree days, agro-climate indicators such as crop suitability, etc.;
- With suitable input data, which can be obtained through measurement campaigns – including in-house developed sensors – set up by ourselves, downscaling of the results can be performed down to 1 meter;
- Based on downscaled data, we can investigate thermal comfort, loss of labour, health impacts, etc. and more importantly, the design and assessment of adaptation measures;
- We also have experience with generation of seasonal forecasts and climate extremes (including precipitation and wind speeds), etc.
What you can expect
Requested climate data can be provided as raw or translated model output (netcdf), as geo-referenced maps (geotiff), and as high resolution quicklooks (.png) allowing easy dissemination.
We also have a lot of experience in designing and developing interactive data viewers and dashboards.
Some example climate data:
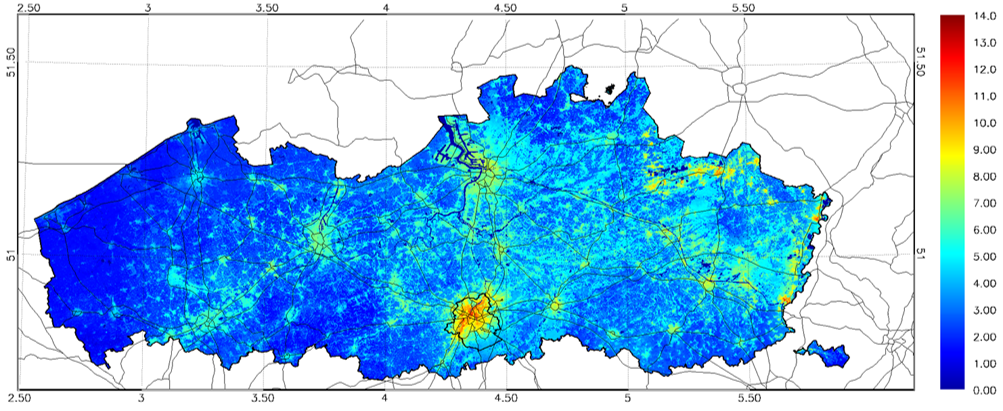
Average number of heat wave days per year for the period 2000-2016 at 100 m spatial resolution according the Belgian Federal Health administration definition
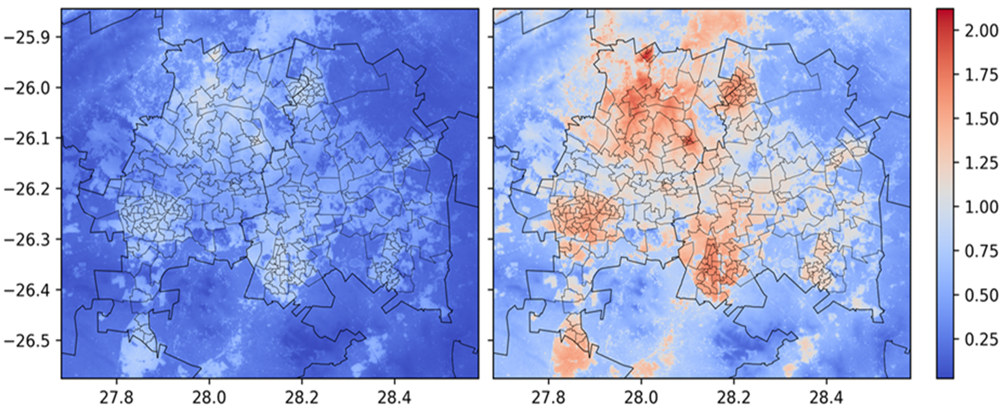
Percentage of heat-related excess mortality for present (left) and mid-century (right) conditions over Johannesburg & Ekurhuleni (South Africa)
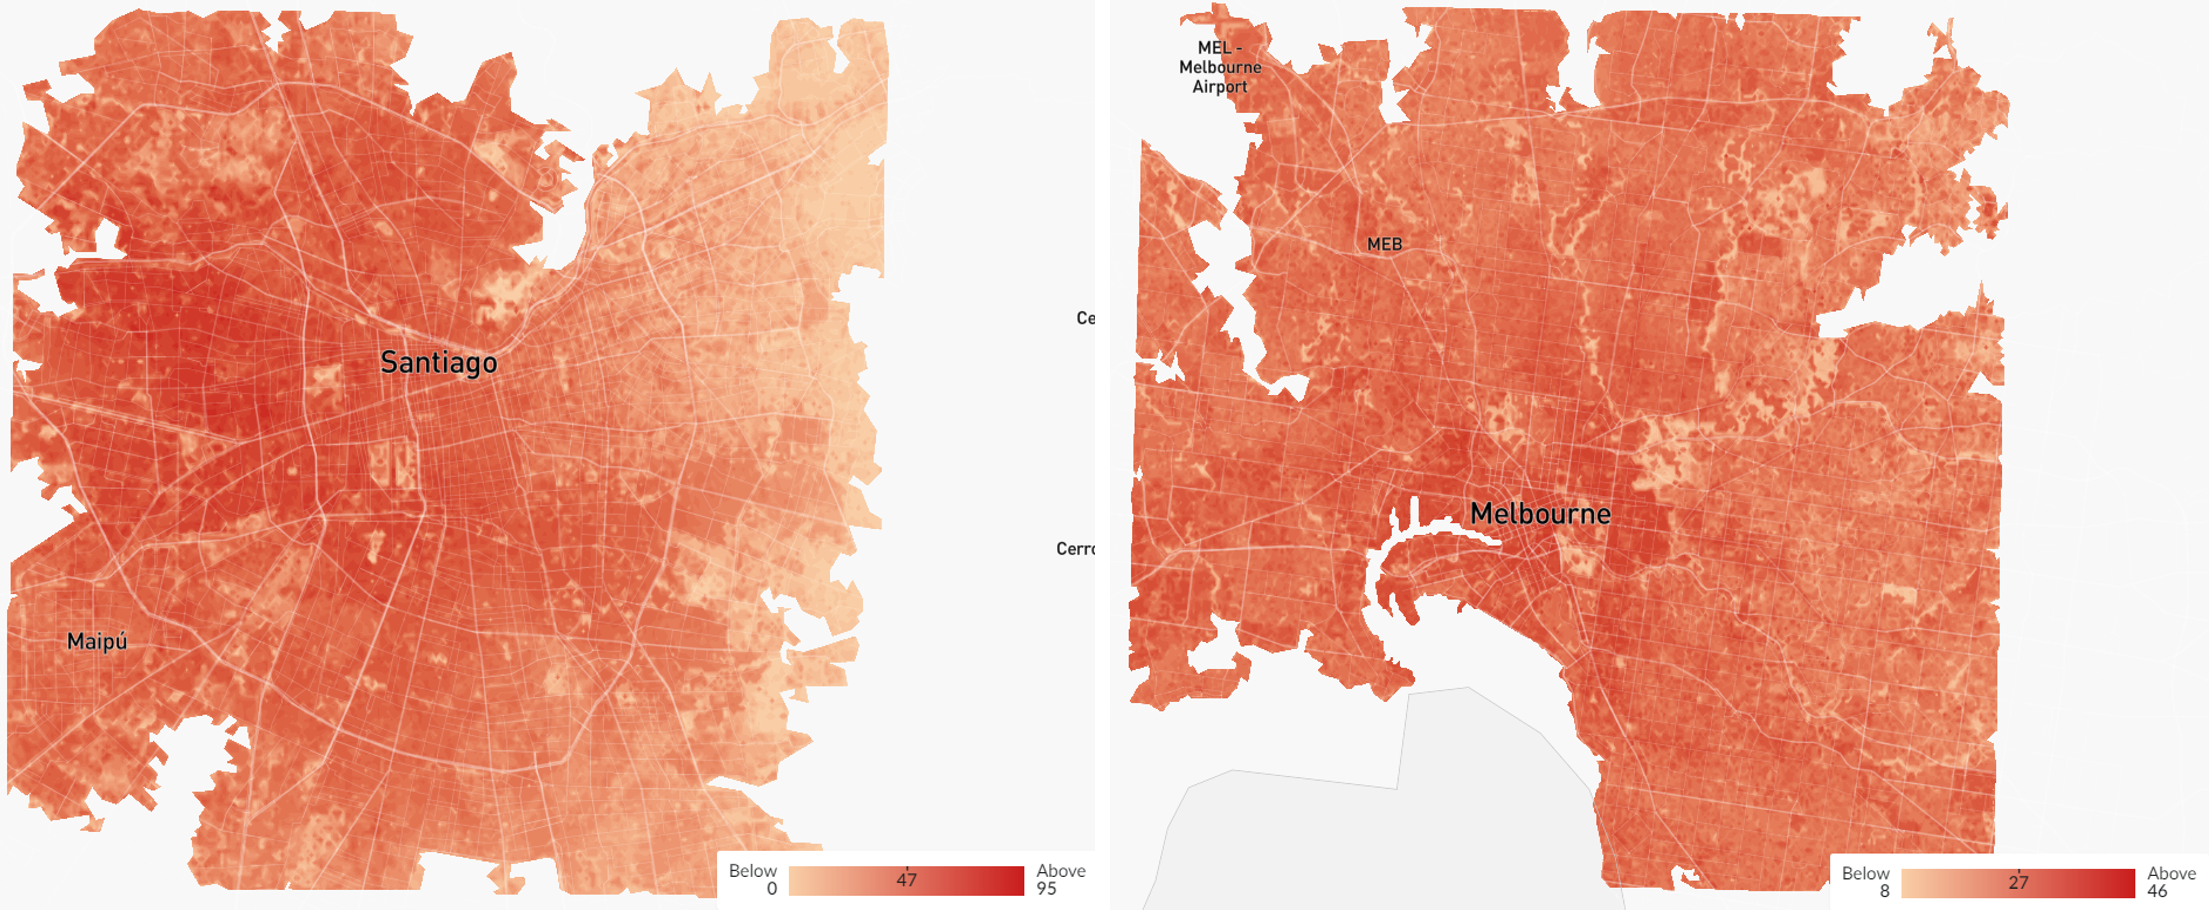
Number of heat stress days per year in Santiago (Chile) and Melbourne (Australia)
Example indicator infographics

Street-scale level heat stress (Wet-Bulb Globe Temperature) mapping for the city of Berlin. Data can be downloaded from Heat stress indicators at 1m and 30m for Berlin-Brandenburg (zenodo.org)
Download
Detailed urban climate data is readily accessible via free download.
Download UrbClim data
Historical climate variables (2008–2017) for 142 cities across Europe, previously provided by the Copernicus Climate Data Store.

Climate services and data